PyTrx published in Frontiers in Earth Science
Frontiers in Earth Science recently published our work on PyTrx, the Python toolset developed during my PhD for processing oblique time-lapse imagery of glacial environments. The toolset is freely available via pip install and GitHub, and this paper serves as its companion piece to inform users of its capabilities and applications.
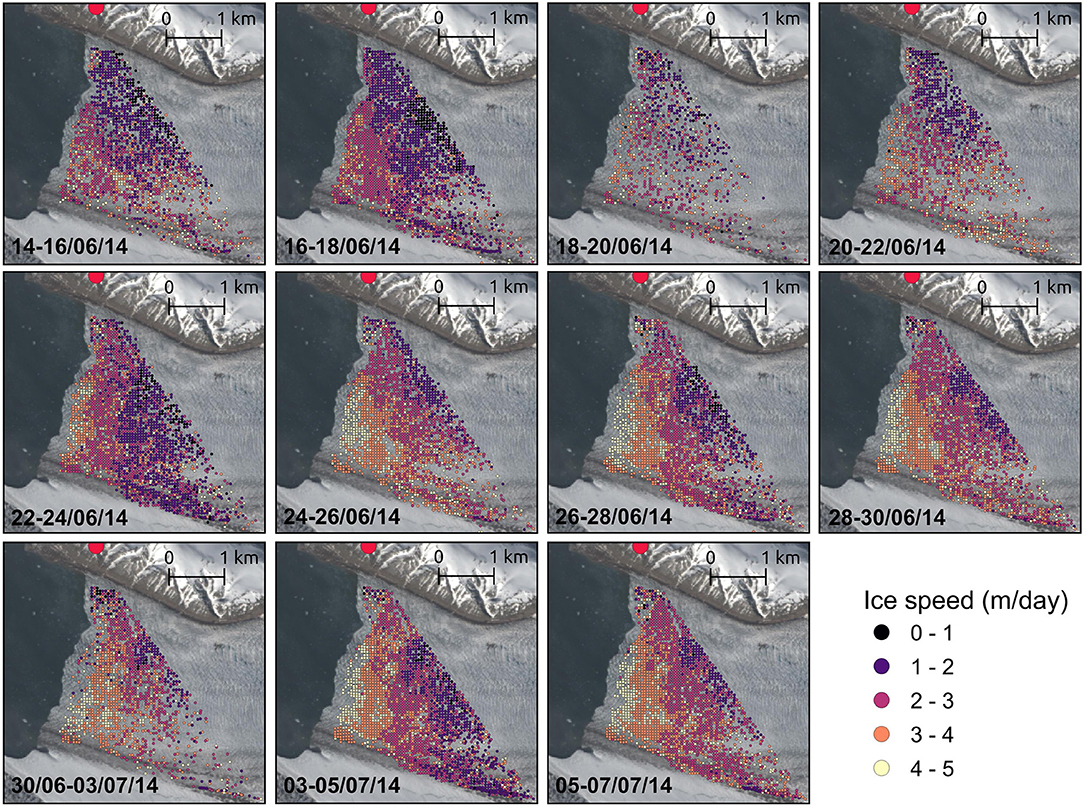
Figure 5 from our Frontiers publication, demonstrating PyTrx’s dense feature-tracking and georectification capabilities. Velocities were determined from oblique time-lapse image pairs between 14 June and 7 July 2014 at Kronebreen, a tidewater glacier in Svalbard. Templates (represented here as points) were defined over a 50x50 m grid, which were matched between image pairs using normalised cross-correlation and filtered by correlation (i.e. templates were retained where the correlation of the match was above 0.8). The sequence shows an early season speed-up at the terminus of the glacier, where velocities increase from an average of 2.5 m/day (14-16 June, first panel) to 4.7 m/day (5-7 July, last panel).
PyTrx came about as I wanted to derive measurements from time-lapse imagery, which I had collected from Kronebreen and Tunabreen, two tidewater glaciers in Svalbard. However, I couldn't find any openly available toolset that met my needs. There are a handful of toolsets for processing ice velocities from time-lapse imagery (see ImGRAFT, Pointcatcher and EMT - three great examples), but I wanted to also process other types of measurements, such as meltwater plume footprint extents, supraglacial lake areas, and changes in terminus position. Additionally, most toolsets that I came across were programmed in a limited range of programming languages, mainly Matlab, and I felt there was a need for a toolset in an open-source programming language for those who wanted an alternative that did not rely upon a licensed software.
We set about making PyTrx just for our own processing needs at first, programmed in Python and largely utilising OpenCV, a Python package that handles complex computer vision operations on optical imagery. Before long, we realised there was a need for this toolset in the public domain, with growing interest from others; hence why we began focusing on finalising PyTrx as an operational package that anyone could use.
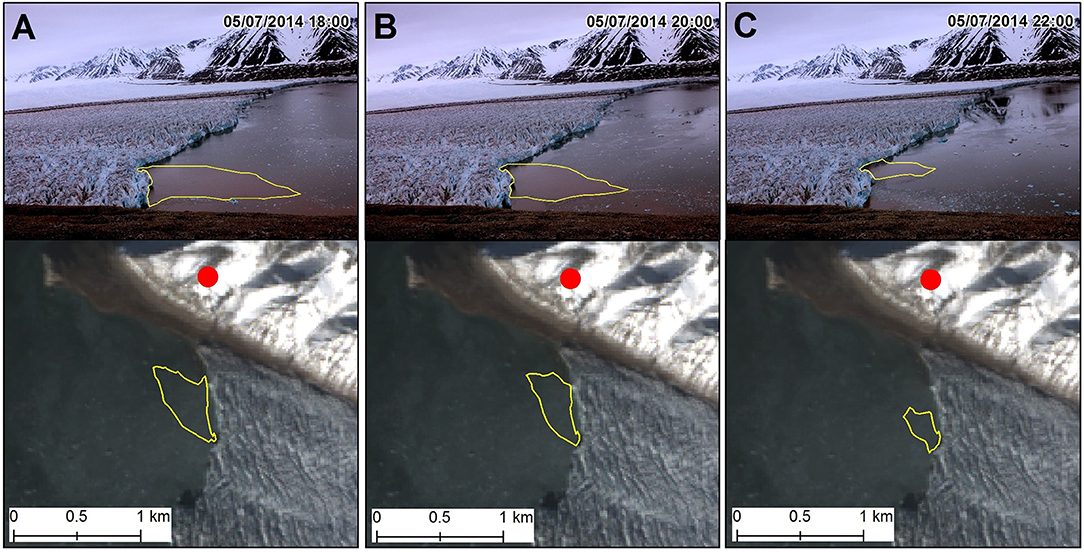
Figure 8 from our Frontiers publication, showing changes in meltwater plume extent distinguished from time-lapse imagery of Kronebreen using PyTrx. The surface expression of the meltwater plume has been tracked through images captured on 5 July 2014 at 18:00 (A), 20:00 (B), and 22:00 (C) to demonstrate part of its diurnal recession. Each plot shows the plume definition in the image plane (top) and its translation to real-world coordinates and plotted onto a coinciding Landsat 8 satellite image (bottom).
PyTrx has been developed with object-oriented design, meaning that the core functions are wrapped in callable-objects, which make it accessible to beginners in programming whilst also serving those more experienced. The following main functions can be performed with the toolset: dense template matching and sparse Optical Flow methods for deriving velocities, automated detection of area features (such as supraglacial lakes), manual delineation of area and line features (e.g. meltwater plume footprints, terminus position), and camera calibration and optimisation for refining the georectification of measurements from the images.
There were many stumbling blocks when it came to publishing PyTrx. I struggled as the feedback, although positive, was a large undertaking that made me question PyTrx's worth and I doubted my own capabilities in delivering a sound toolset to the glaciology community. Overall though, the review process brought about big changes to PyTrx, which were absolutely essential to improving and finalising the toolset. I have a lot to thank for the review process, without which the toolset would not have reached its full potential and be what it is today.
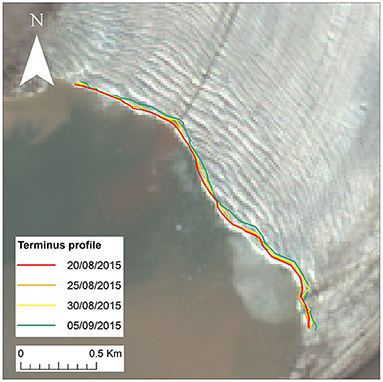
Figure 9 from our Frontiers publication, demonstrating PyTrx’s ability in extracting terminus profiles from Tunabreen, a tidewater glaciers in Svalbard. Terminus lines were manually traced from sequential time-lapse images, and subsequently georectified to provide a record of terminus retreat.
Links
PyTrx publication in Frontiers- our paper, describing the toolset and its applications using time-lapse imagery of tidewater glaciers in Svalbard
PyTrx GitHub repository - where PyTrx can be downloaded from (the master branch is where the raw scripts are, whilst the distribution branch holds the package files and readthedocs materials
PyTrx readthedocs - PyTrx guide and code documentation
PyTrx on PyPI - PyTrx’s package distribution via pip