PhD Update: October 2016
It is known that supraglacial lakes on the surface of a glacier fill and drain over the course of a summer melt season. Lake observations from time-lapse photography at Kronebreen glacier in Svalbard show possible links between their drainage and changes at the glacier bed. This month I have been further investigating these lakes using satellite imagery and other data to find that these lakes have formed and drained in similar positions for at least 30 years, indicating that the subglacial environment is relatively consistent year-on-year.
Time-lapse images at Kronebreen show lake drainage at the end of June in both 2014 and 2015. These lakes have a maximum surface area of 18,000 sq m and appear to fill and drain simultaneously, sometimes appearing to be a brown, sediment-heavy colour suggesting that they are directly connected to the glacier bed.
Supraglacial lakes filling and draining in the upper section of Kronebreen glacier, Svalbard. The sequence covers June to July 2015, one image per day.
These lakes were tracked through time based on pixel intensity and then geo-rectified using the camera position, a three-dimensional representation of the landscape (DEM) and ground control points (GCPs) to map them in real world coordinates. For more on the details of how this method works, see an earlier post here. The three sets of lakes tracked from the 2014 sequence have an upglacier pattern of drainage - the lower lakes fill and drain first, followed by the upper glacier lakes. As it is likely that these lakes are connected to the glacier bed, it is possible that their pattern of drainage show an upglacier-propagating flushing event at the bed. A trigger causes subglacial meltwater near the glacier front to drain which subsequently draws down meltwater from further upglacier, draining the lower surface lakes before the upglacier lakes.
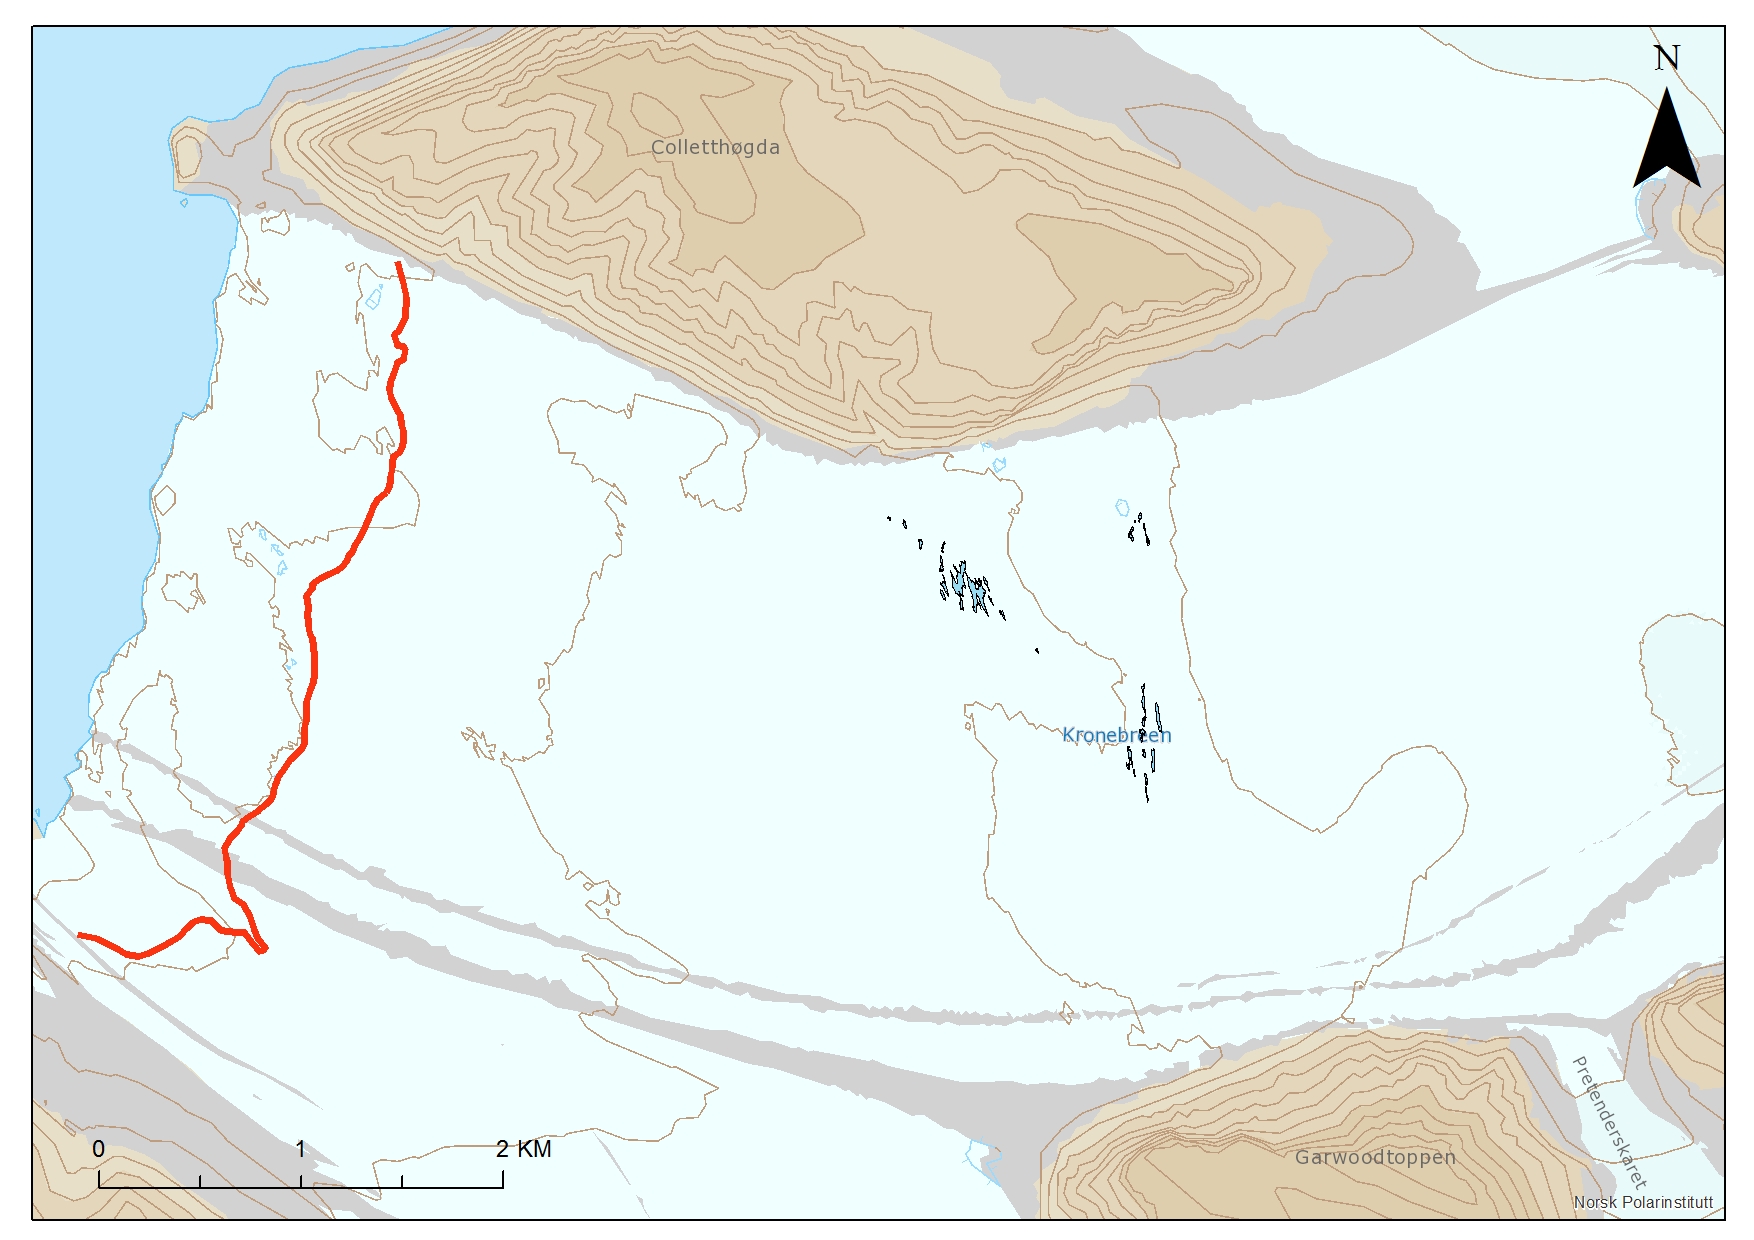
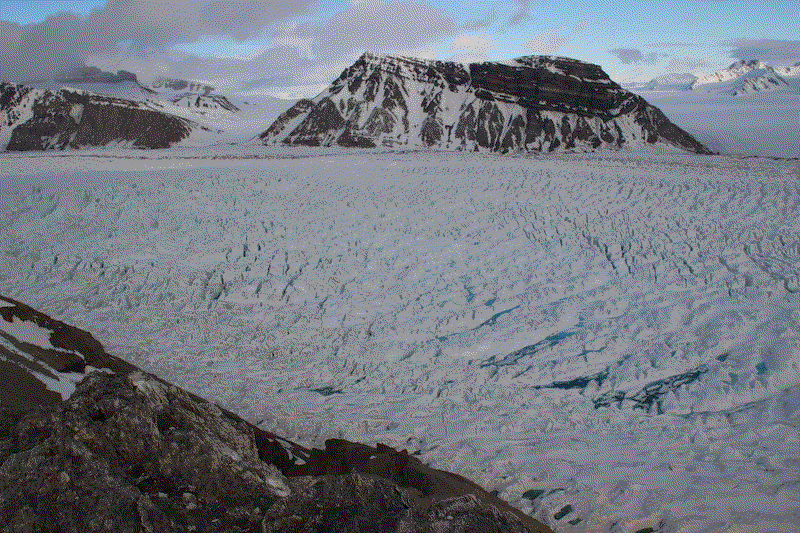
Surface lakes on Kronebreen in the 2014 summer melt season (the red line indicates the 2014 terminus position). These lakes were mapped from time-lapse imagery acquired from two camera positioned on Collethogda and Garwoodtoppen, the two outcrops to the north and south of the glacier tongue. The lakes are automatically detected based on the pixel intensity in the image and mapped in the image plane. Then the shapes are geo-rectified to place them in real world coordinates. Base map supplied freely by Norsk Polarinstitutt

Surface lake area tracked through the Kronebreen time-lapse image sequence from summer 2014. Here, automatically detected lakes are determined from images every half hour (apart from images with poor illumination or cloud cover). There is slight flickering at the beginning of the sequence when the lakes are at their largest due to changing illumination conditions, but generally the automated detection shows the rapid drainage. After the drainage, the lakes appear to shift upwards (i.e. perpendicular to the ice flow from right to left). This signifies that a significant surface lowering event has taken place, with the lowering appearing as movement towards the time-lapse camera. This supports the idea of a upglacier progression of drainage, with the glacier surface lowering as the system is no longer hydraulically jacked.
As we only have images of these lakes from 2014 and 2015, I had a look at archived Landsat satellite imagery of the area to see if these lakes appear in similar places in earlier years. Overall, I found that lakes consistently appear year-on-year around the same time in the same places, at least back to 1986, which is 30 years ago. From here, we are working on acquiring more satellite imagery to further investigate whether these lakes are consistent and also whether there are additional lakes in other areas on the glacier tongue. Initial assessment shows that there are other lakes nearer to the terminus that appear infrequently, suggesting that the subglacial system is dynamic and not as consistently configured as we first thought.

Landsat image of Kronea hrefbreen from 23rd July 1990, showing surface lakes that appear in a similar region year-on-year. Landsat imagery from 2011, 2001, 2000, 1990 and 1986 (i.e. all years without cloud cover or poor imagery) all showed lake formation and drainage in the same area. Landsat imagery freely accessed from the USGS LandsatLook Viewer.
I presented this work at the International Glaciological Society (IGS) Nordic Branch Meeting at the end of this month, which was held at the Norsk Polarinstitutt in Tromsø. Generally the presentation went really well, probably one of the best presentations I have ever done! There were a number of people at the conference working on Kronebreen, so it was especially helpful to see what they were doing and have input from them. We also had a lot of discussions more generally about Kronebreen and the techniques that we are using to acquire data from time-lapse imagery. The conference was very well organised and a great success so I would like to say thank you to those involved in making it happen.