PhD update: November 2015
Bed water pressures correspond to surface lake drainage events at Kronebreen
November has well and truly been office-based apart from a trip to Aberdeen for the annual Scottish Universities Research in Glacial Environments (SURGE) meeting, where I presented some of my recent work from this month. This work has largely been focused on:
1. Continuing my work with the surface ponds on Kronebreen, time-lining their filling and draining in relation to our borehole water pressure record 2. Examining the calving behaviours at the terminating margin of Kronebreen using our high-resolution time-lapse sequence, capturing images once every three seconds for 60 hours (2-4th September 2015)
The relative surface area of each pond was monitored from our 2014 time-lapse sequences. In total, the water level in 16 ponds was tracked from May to September 2014. These ponds can generally be divided into two clusters, which fill and drain simultaneously indicating local hydraulic connectivity. The dynamics of these two clusters appear to act independent of each other, with an abrupt drainage event at the back cluster and longer prevailing ponds at the front cluster (locations in relation to camera 5 - see map for more detail) .
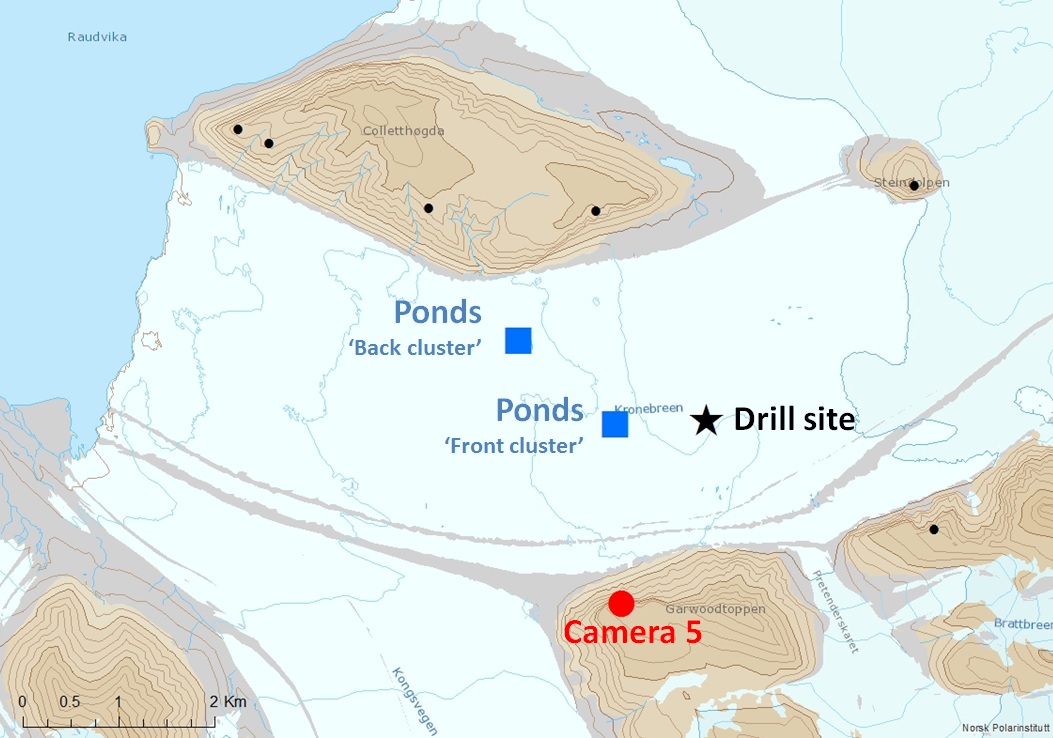
Map showing the tracked ponds from camera 5 (May - September 2014) in relation to the borehole drill site where a pressure sensor was installed in September 2013. The drill site is approximately 1 Km from the front cluster of ponds, and 2 Km from the back cluster of ponds.
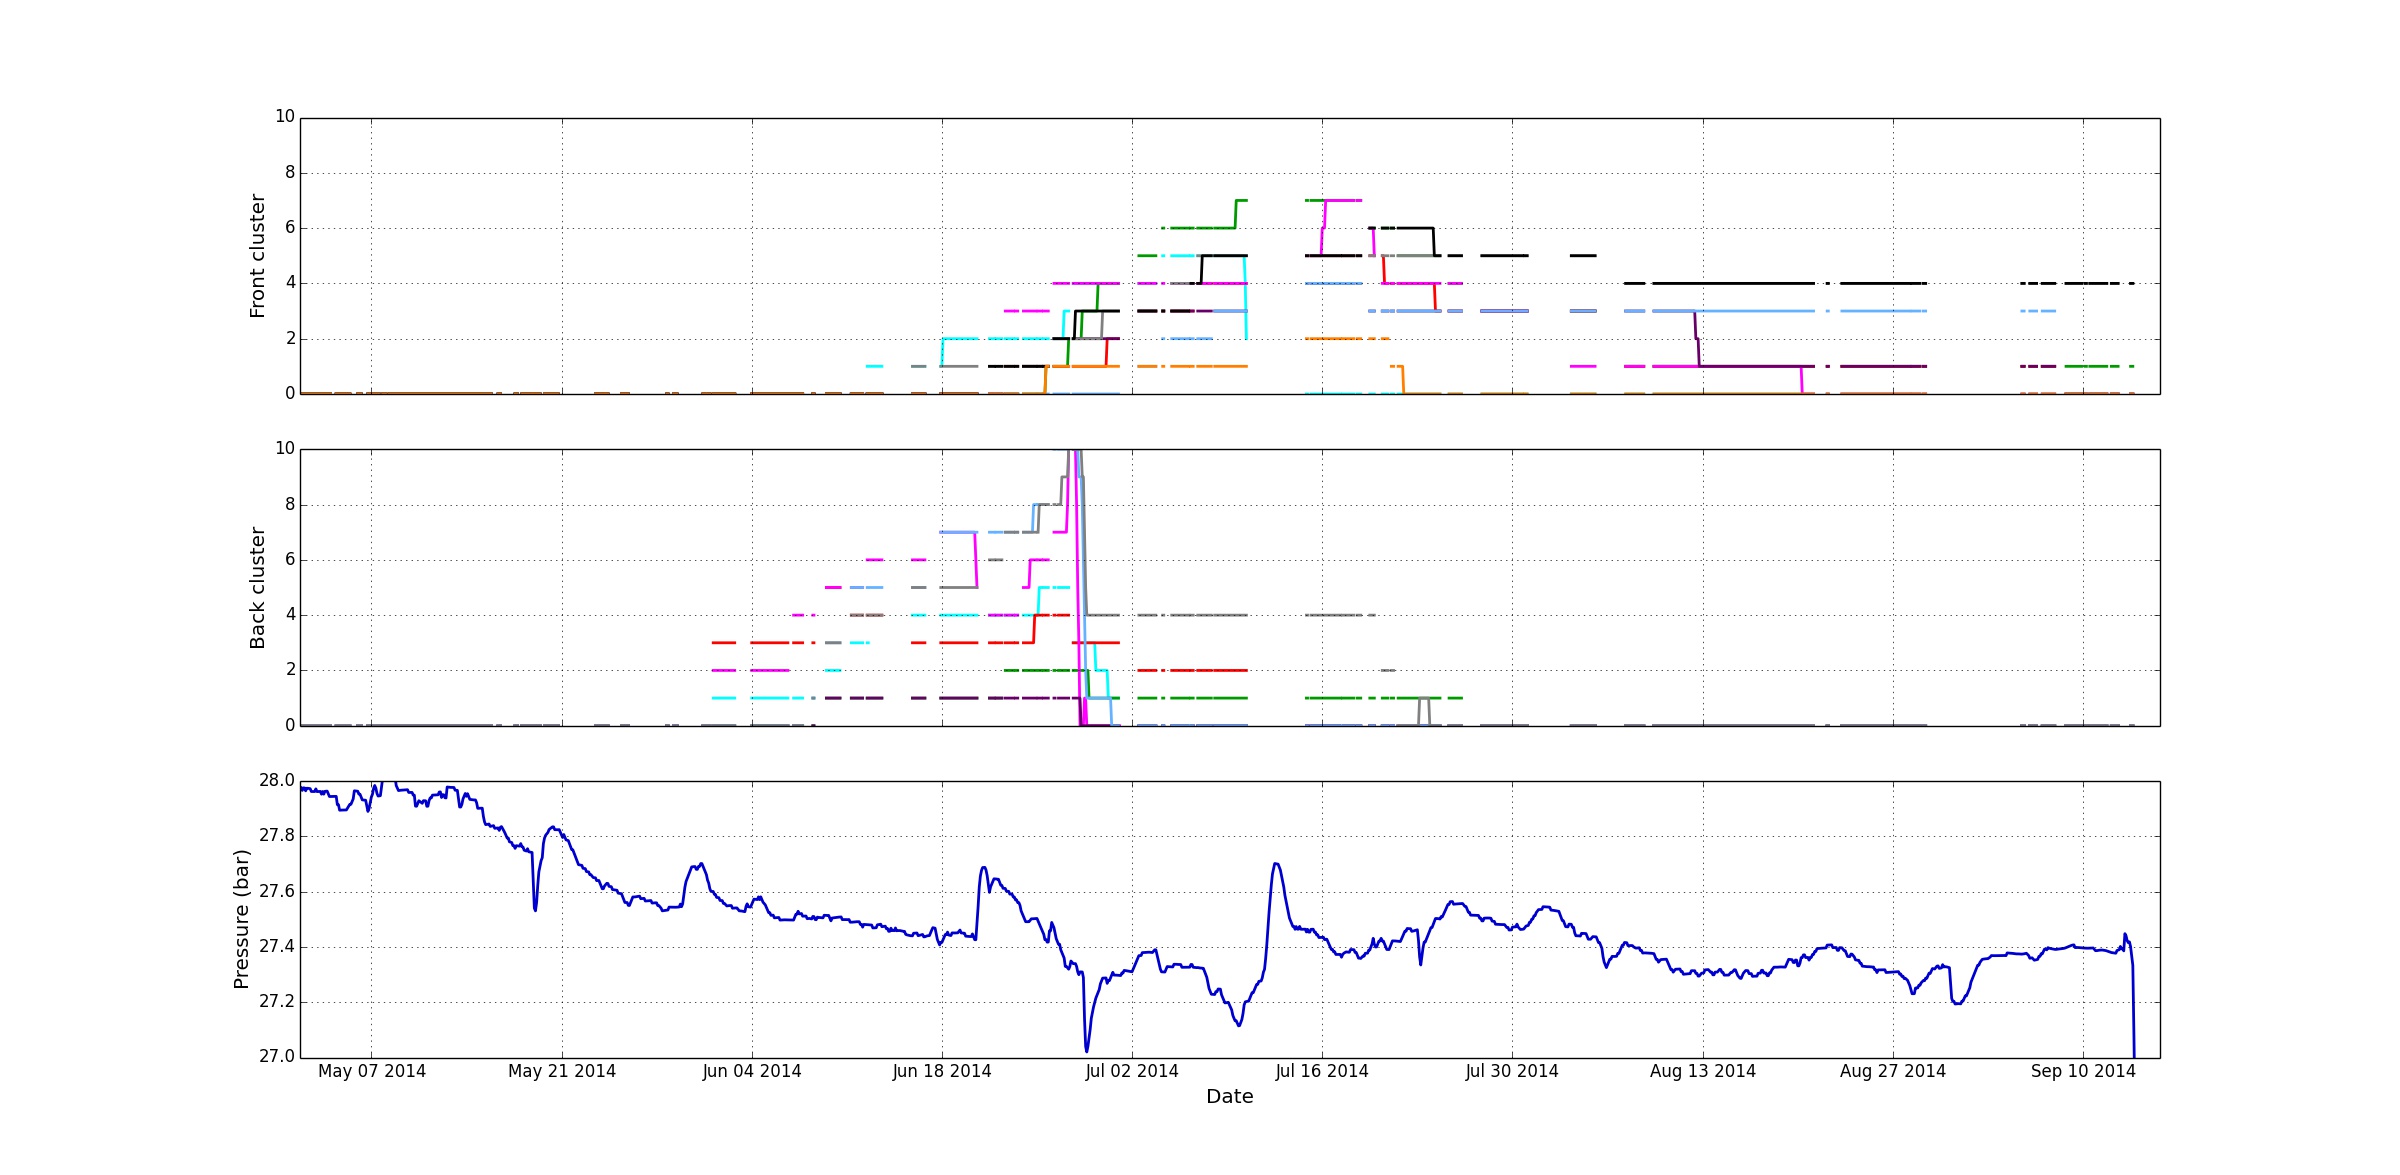
The levels in these pond clusters can be compared to our borehole data, which recorded the water pressure at the glacier bed over 14 months (including the duration of the 2014 time-lapse camera installations). The significant finding from this comparison is the substantial drainage event from the back cluster coinciding with a 0.3 bar drop in water pressure at bed, indicating strong cross-glacier hydraulic connectivity. This also corresponds with the beginning of plume activity at the glacier front (i.e. upwellings of glacier meltwater in the immediate fjord area which form a significant part of submarine glacier melting).
Previous understanding suggests that the surface velocity of Kronebreen is controlled by ‘stick’ and ‘slide’ points on the glacier bed, dictated by local bed pressure. But here, it looks like the pressure at the bed is actually relatively uniform and the surface velocity is primarily controlled by the topography of the bed e.g. topographic high points on the bed act as ‘pinning points’.
https://github.com/PennyHow/pennyhow.github.io/blob/master/assets/images/ponds_press_graph.jpg
 </a>
</a>
Pond levels (tracked from camera 5 on Garwoodtoppen) compared to bed water pressure (sensor installed using hot water borehole drilling) from May to September 2014. Note the coinciding drainage event at back cluster and the bed water pressure drop on 28th June (click to enlarge).
The beginning of the plume activity at the glacier front signifies a key change in the calving regime at Kronebreen, with high calving rates concentrated around where the two plumes emerge at the fjord surface. This creates embayments, or notches, in the glacier front. An ice headlands develops in between the two plumes where the calving rate is slower.
From looking at our high resolution time-lapse sequence, we see two types of calving at Kronebreen - subaerial and subaqueous. Subaerial calving occurs above the waterline with blocks of ice often falling from a great height. Subaqueous calving occurs beneath the waterline, with large chunks of dirty, blue ice emerging from the fjord. Subaerial calving is generally more frequent, cause by a force imbalance created when undercutting at, or below, the water surface occurs. A subaqueous calving event occurs once a substantial area of the subaerial part of the glacier front has receded and the buoyancy of the ice beneath the water surface overcomes the strength of ice.
What I am doing next is document the 383 calving events that occurred in the 60 hours covered in our high resolution time-lapse sequence. This is to look at the ratio of subaerial to subaqueous calving events, and their distribution across the glacier front. What I am looking for is whether the increase in calving rates during plume activity is linked to more frequent calving events or larger volumes of ice within each calving event.
Till next time!