Key time-lapse studies into glacier dynamics
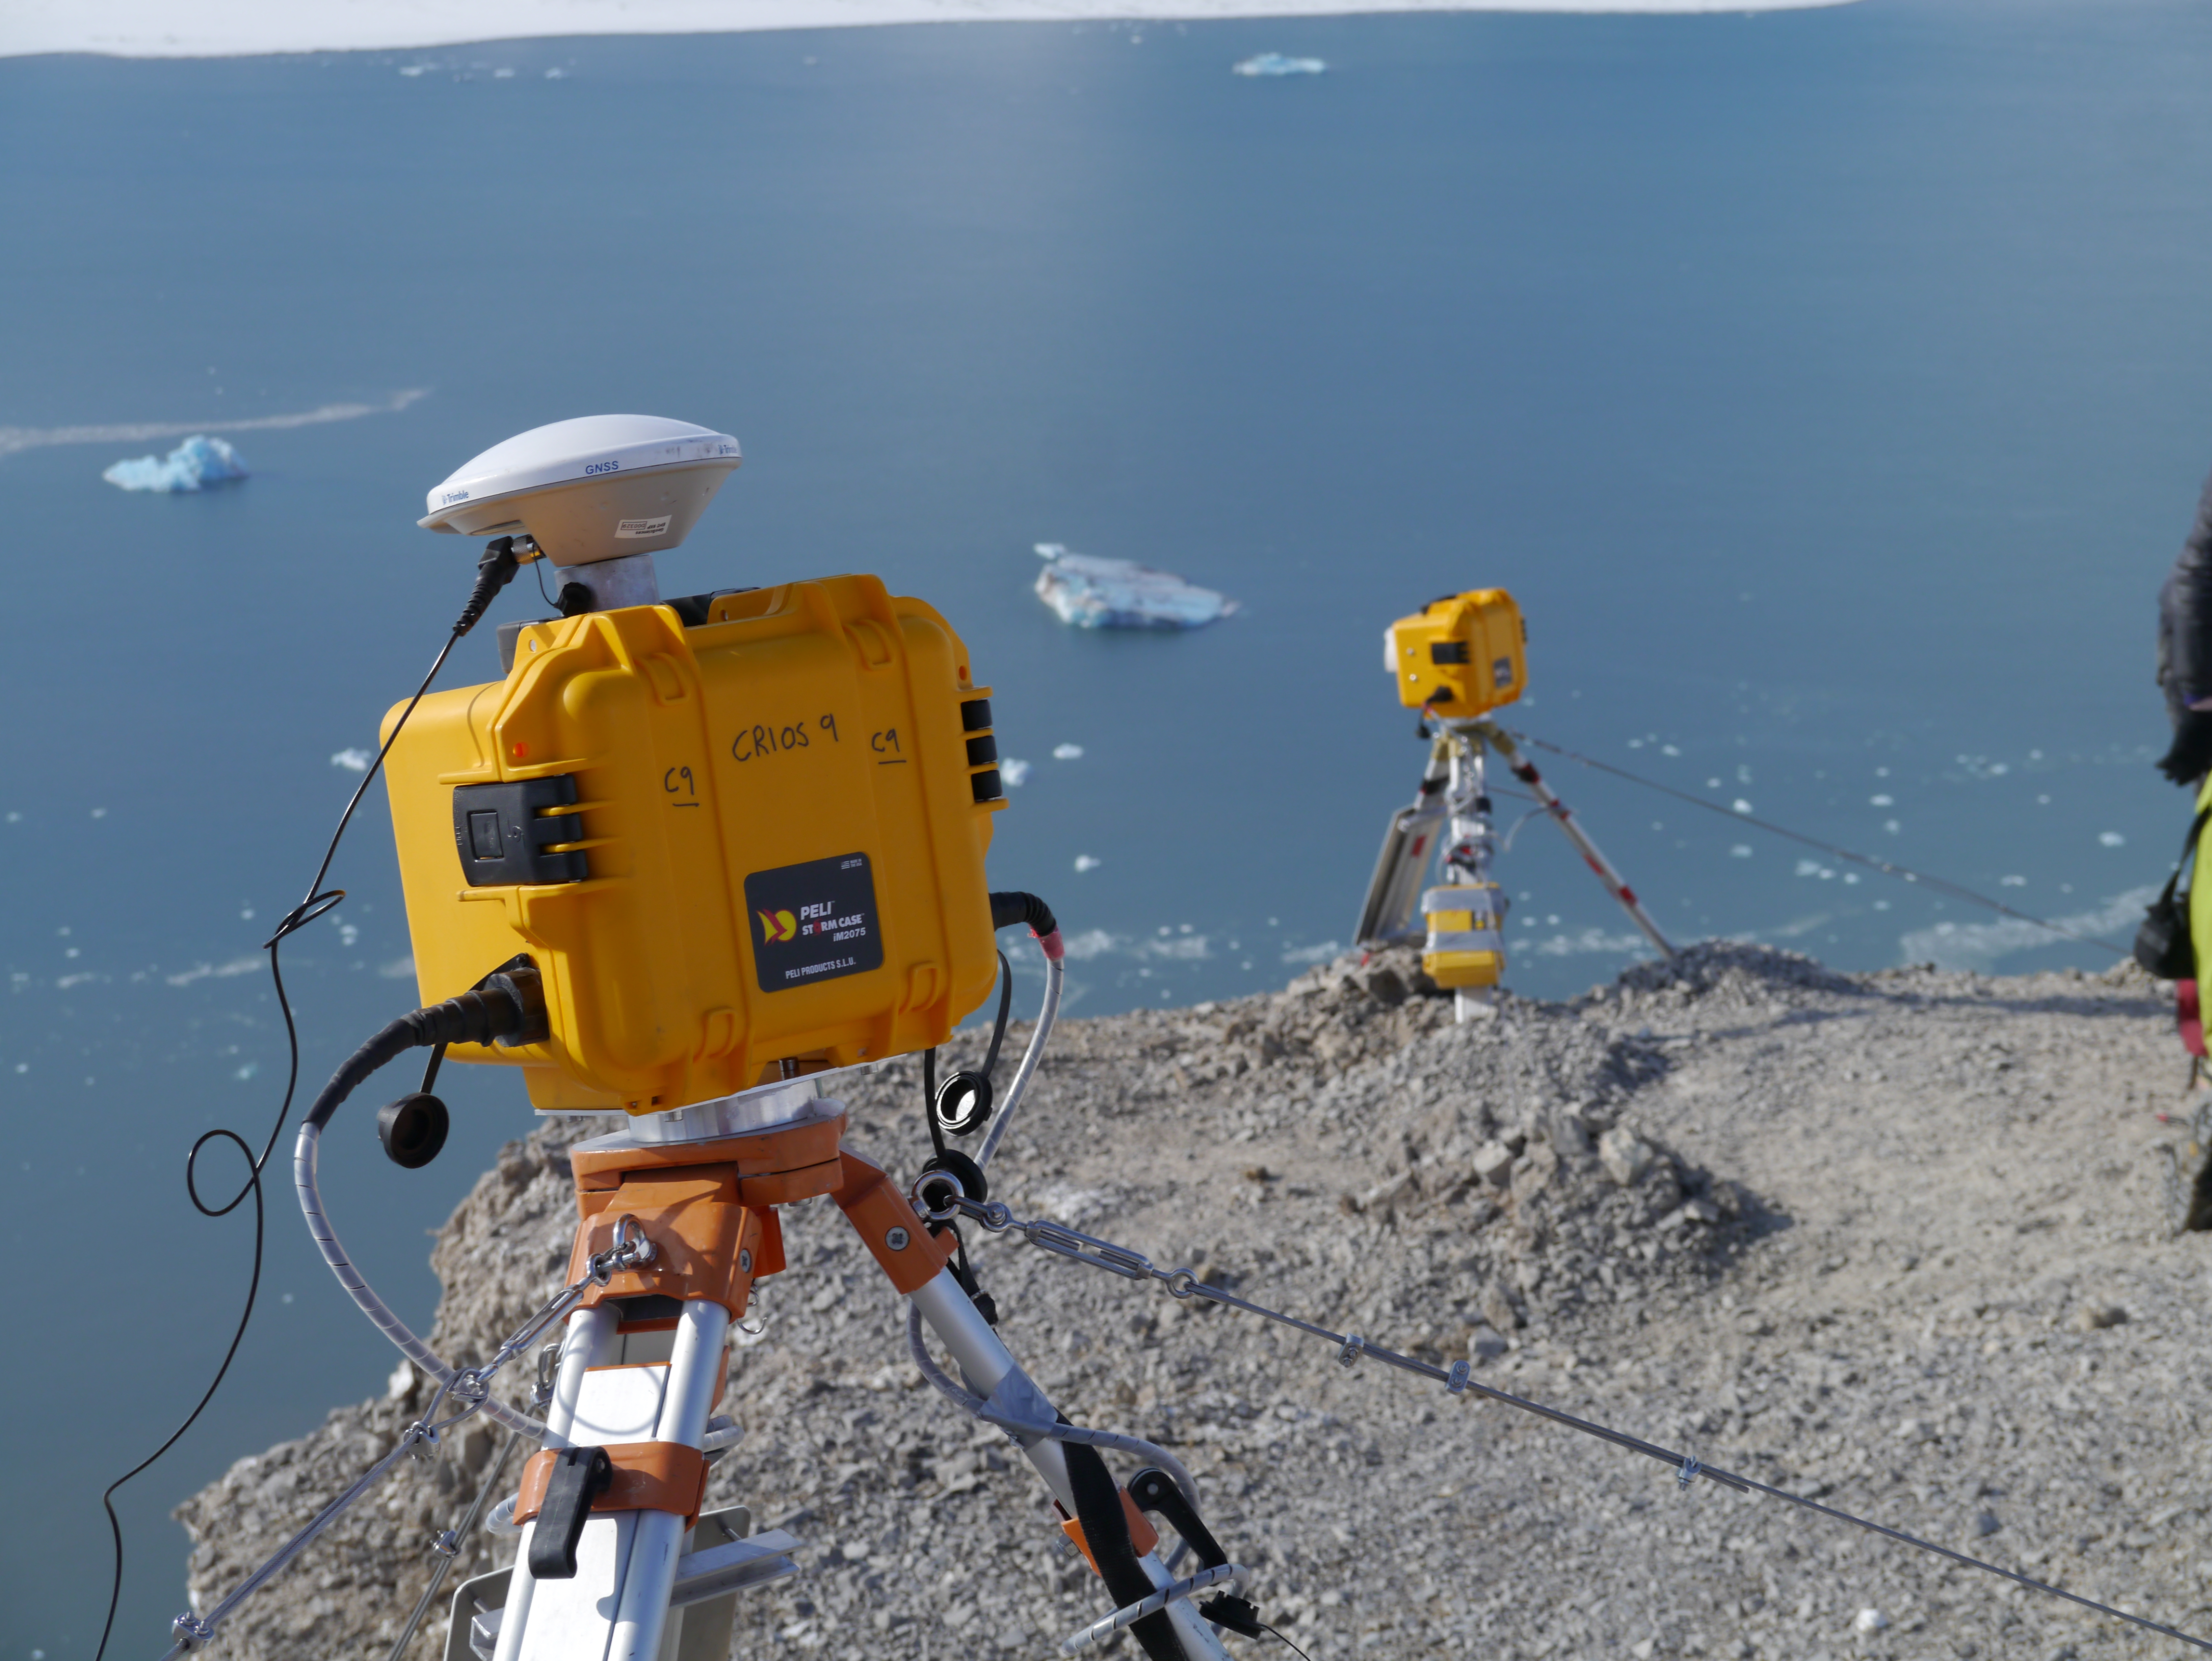
Two of our stereo time-lapse cameras (cameras 8a and 8b) at Kronebreen glacier (Svalbard), which were installed as part of the CRIOS (Calving Rates and Impact On Sea level) project. These cameras were focused on the front of the calving front to look at surface velocities at the glacier terminus in comparison to calving rate (May 2015)
I have been nearing the end of writing the first chapter of my thesis which is an overview of photogrammetry techniques in glaciology with particular focus of time-lapse photogrammetry. Whilst writing this chapter, I have had to review all previous studies which use time-lapse photography. I found that still a large proportion of studies are developing photogrammetry techniques, and there are only a few studies which actually use the techniques to answer the big questions in glaciology. I thought I would share a list of the key papers that use time-lapse photogrammetry to examine different aspects of glacier dynamics... (if there are studies you think I have missed off this list then please contact me, I'm always looking out for more!)
- Dietrich et al. (2007): Examined links between vertical displacement and tidal levels at Jabobshavn Isbræ (Greenland) to determine how much of the glacier tongue was free-floating.
- Ahn and Box (2010): Captured daily images of several glaciers in Greenland (Rink Isbræ, Store Gletscher, Umiamako, Jakobshavn Isbræ) to examine links between surface velocity and calving rate. Concluded that velocity speed-ups were caused by large calving events e.g. calving event at Umiamako caused speed-up (17% acceleration) over the subsequent six days.
- Kristensen and Benn (2012): Captured daily images during the 2003-05 surge of Skobreen-Paulabreen. Observed intensely crevassed ice at the front and lateral margins during the surge, but little crevassing behind the front. Concluded that the surge was almost entirely driven via basal motion (sliding/deformation), facilitated by trapped pressurised water at the bed.
- Danielson and Sharp (2013): Monitored water levels in supraglacial lakes on Belcher Glacier (Canada) using hourly time-lapse images. Linked drainage events in these lakes to four glacier acceleration events (determined using GPS). The time-lapse imagery was also used to determine lake drainage typology, classed by the lake constraints (crevasse or surface topography), connection to the basal hydrology system and the speed of lake drainage.
- Rosenau et al. (2013): Determined changes in the grounding line of Jakobshavn Isbræ (Greenland) over time, using vertical displacements (measured from time-lapse images acquired in 2004, 2007 and 2010) as a measure of flexure. They also examined the position of previous pinning points of the glacier front.
- James et al. (2014): This was the first study to use a high-frequency time-lapse sequence (one image every 10 secs) to observe a large calving event at Helheim glacier (Greenland) (see time-lapse video here). Vertical displacements at the glacier front showed that the rotation calving event was caused by differences in the fjord bed topography which promoted uplift at the north side of the glacier margin and a depression at the south part of the margin, creating an unbalanced buoyancy equilibrium.
From all of this, I have found that the future of terrestrial time-lapse photogrammetry is trending towards its valuable ability to examine different aspects of the glacier system simultaneously - glacier velocity, fjord dynamics, surface lake drainage, calving dynamics... and others. These can be studied using different image capture frequencies and over different lengths of time, and I think we will begin to see much more high-frequency time-lapse sequences based on the useful information gained from them so far.