How time-lapse photography works in the study of glacial processes
Whilst preparing a talk for the Geography research seminar series at the University of Manchester, I decided to include some information on time-lapse methods in glaciology to help introduce the topic. Within this, I wanted to convey how different glacial processes were visible at specific image intervals. By constructing image sequences with various intervals, I could effectively show the processes that occur at the front of glacier and how different processes operate on different time-scales.
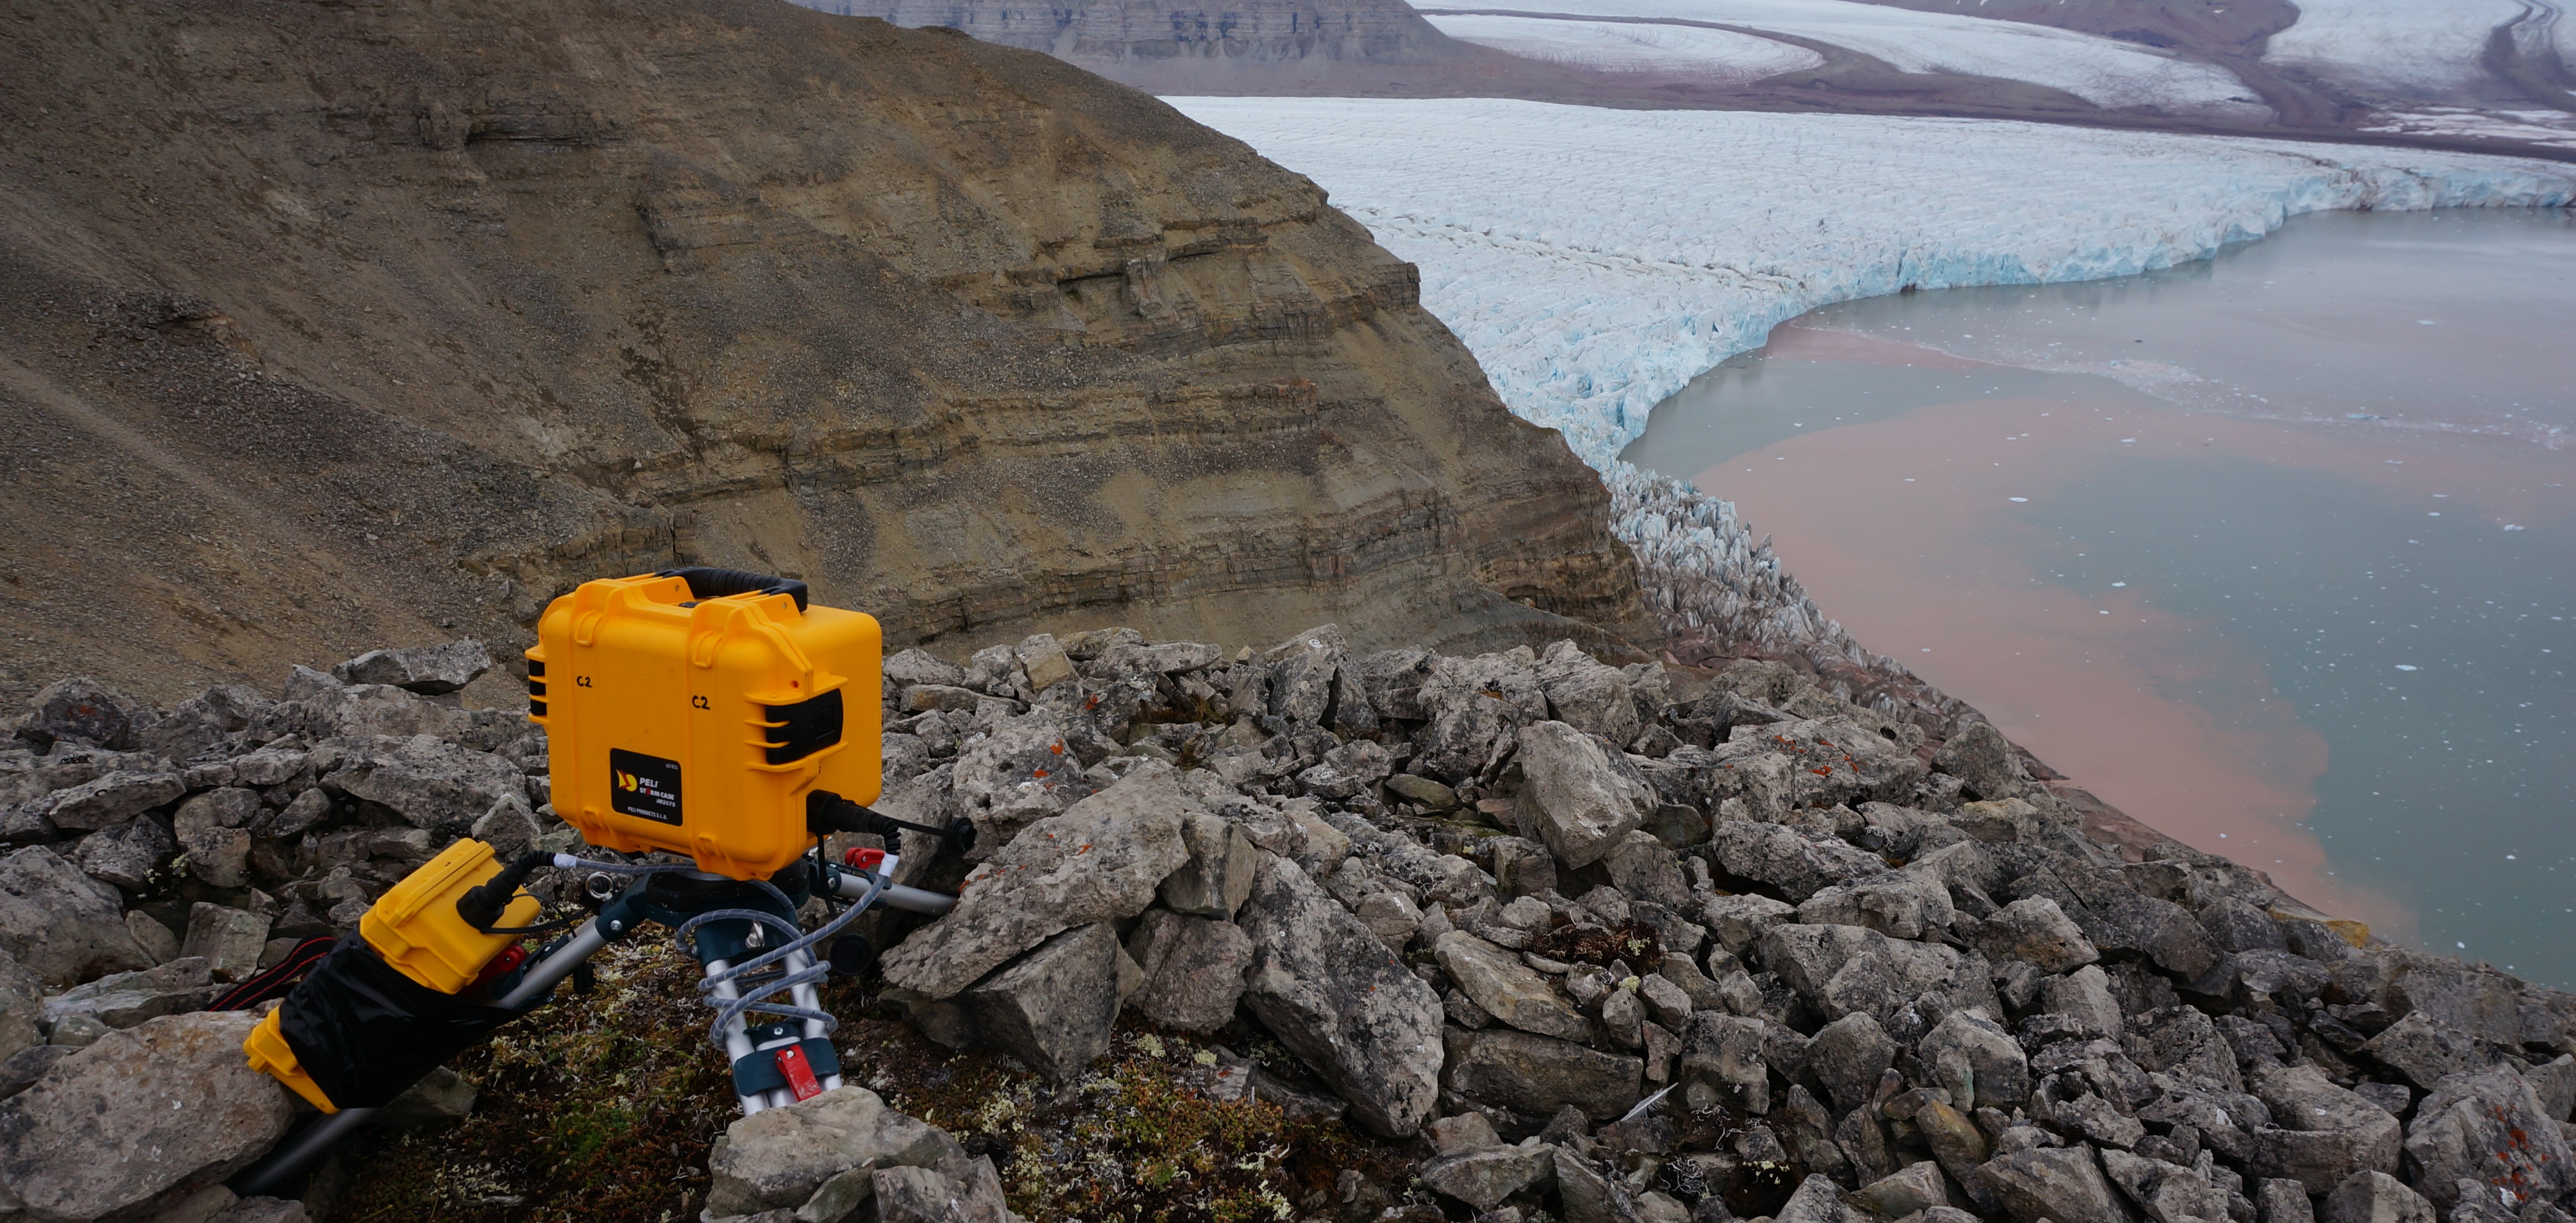
One of our time-lapse cameras looking at the calving front of Tunabreen, a surge-type glacier in Svalbard. This camera remained here taking photos every 10 minutes between August 2015 and September 2016. This camera collected 24,136 images in total.
To begin with, we take a camera and place it in front of the glacier we wish to study. Using an external timer (or intervalometer), the camera can take photos at a set interval. We tend to use small intervals, such as every hour or 10 minutes, from which we can extract image sequences with longer intervals (e.g. one image per day). This camera can be left unattended for a period of time, accumulating images of the glacier. We normally leave our cameras for a summer melt season (May to September) because either the memory card is full or the camera system needs servicing. For more information on the elements of a time-lapse camera system and how it is powered, see here.
Once the camera has been collected, the images can be used to construct image sequences from which observations and photogrammetric measurements can be made. These images can either be selected manually to maintain consistency in illumination or based on time interval. Glacial processes are more apparent when illumination is consistent. This is especially beneficial for looking at longer-term processes such as glacier movement. By constructing a sequence using one image per day with consistent illumination, glacier movement is apparent along with changes in terminus position (see below).

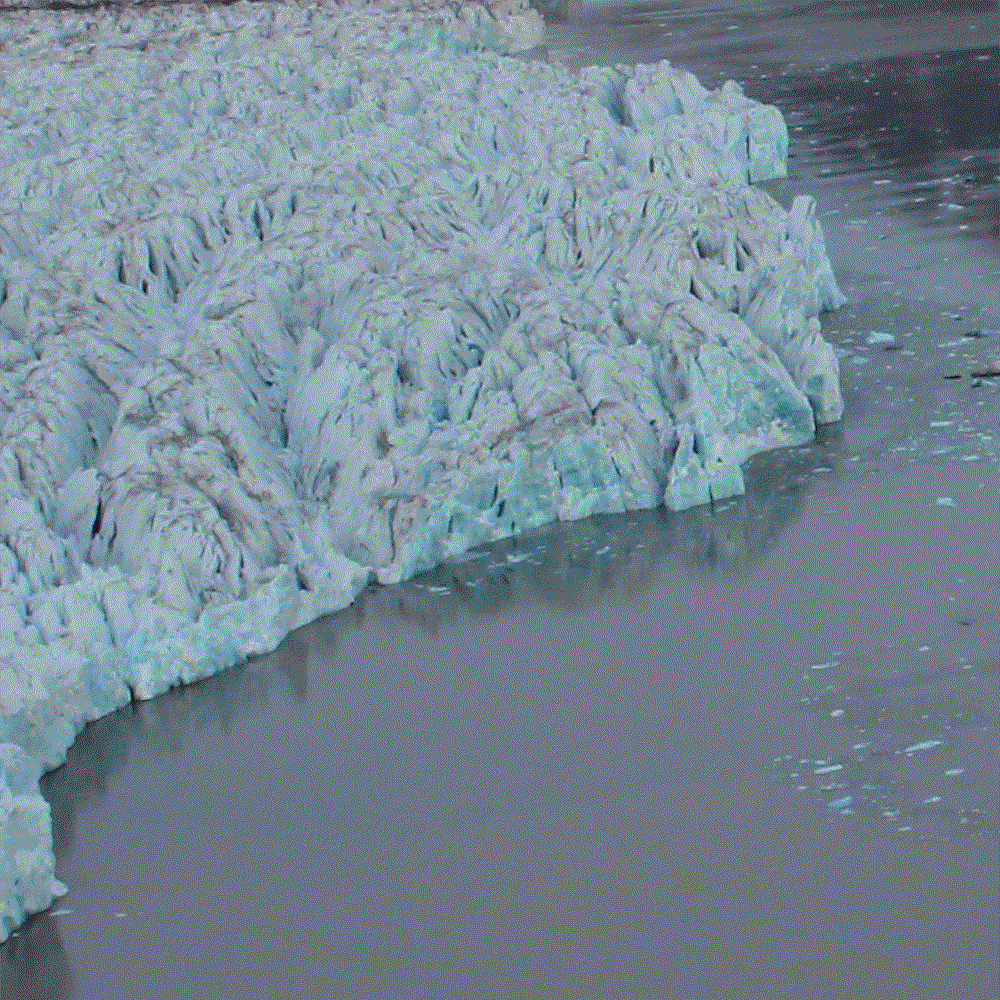
An image sequence constructed from one photo a day at the front of Kronebreen glacier in Svalbard. This sequence spans 15 June to 26 July 2016, covering part of summer melt season. During this phase, the glacier is moving approx. 3 metres per day and calving activity is high. The muddy water in the fjord indicates that meltwater is exiting the glacier, forming a submarine plume that interacts with the saline fjord water.
Over a summer melt season, marked changes at Kronebreen glacier, Svalbard, are visible. As ice in the upper region flows into the fjord, ice breaks off at the front as if it is being 'nibbled' away. This is known as the rate of frontal ablation. The rate of frontal ablation is higher in the area nearer to the camera due to the presence of a submarine plume, creating a small embayment in the glacier front. The region adjacent to this embayment retreats very little, leaving a preserved pinnacle in the middle of the glacier front. Its retreat rate is likely to be the result of a low frontal ablation rate controlled by a rapid delivery of ice to the region and low calving activity. This region of the glacier front also sits on a topographic high in the sea bed, which has pinned the front in a stable location.
We can examine the processes that contribute to these long-term changes in an image sequence constructed from images at shorter intervals. The sequence below is composed from images of Kronebreen every 10 minutes, covering 4 hours (real-time) in total.

An image sequence constructed from one photo every 10 minutes at the front of Kronebreen. This sequence spans 4 hours real-time (2-6pm 1st September 2016), showing conditions at the end of the summer melt season. Here, the circulation in the fjord water can be distinguished based on the movement of icebergs, migration of the submarine melt plume is seen, and calving ice from the glacier front is visible.
Compared to the previous image sequence, we see a different picture here. We no longer visibly see glacier movement or change in the glacier front position. Instead we see shorter-term processes such as migration of the submarine melt plume surface expression. This can be used as an arbitrary measure for the amount of meltwater leaving the glacier. We can also observe icebergs moving in the fjord which can be tracked to indicate patterns of small-scale fjord circulation. This can be especially useful for examining submarine melt, specifically how the fjord water interacts with the front of the glacier.
We can isolated events with even shorter interval image sequences. Over the past year, we have been experimenting with high-frequency time-lapse methods, capturing one image every three seconds for short periods at Kronebreen. Image sequences constructed from one image every three seconds can look similar to video, better showing processes in a high level of detail. This has been especially useful for looking at individual calving events and the study of calving mechanisms.
An image sequence constructed from one photo every three seconds, showing a large calving event at Kronebreen. This sequence covers two minutes real time at the end of the summer melt season 2015 (00.18 to 00.20).The iceberg that breaks off is approx. 100m wide, 50m high (above waterline only).
Above is an example of a large calving event at Kronebreen at the end of the summer melt season 2015. It is visible to distinguish that this calving event is the result of a complete failure through the ice column, with ice breaking off from above and below the waterline. Initial failure at the top of the ice face causes a rotational break-off of the ice below this, which is likely to have been encouraged by a pre-existing weakness in the ice column such as a small crack or crevasse.
Hopefully with these sequences I have illustrated that different sets of glacial processes work on different timescales. One of the main advantages of time-lapse photography and photogrammetry techniques is that we can adjust the interval rate to look at the process we wish to examine, making it much more flexible than other imagery acquisition. We hope that time-lapse techniques will continue to be used in the study of glacial environments. It is likely that with the ongoing development of camera technology, there will soon be more advantages to using time-lapse photography and photogrammetry.