A dummies guide to… my PhD thesis on glacier dynamics
Recently my PhD thesis was made available online through the Edinburgh Research Archive, titled 'Dynamical change at tidewater glaciers examined using time-lapse photogrammetry'. The thesis is 342 pages long which would be a marathon to get through for anyone, so here is a short synthesis.
In a nutshell
Title: Dynamical change at tidewater glaciers examined using time-lapse photogrammetry
Goal: To understand processes linked to dynamical change at tidewater glaciers.
Three main aims:
- Examine subglacial hydrology and its influence on glacier dynamics at Kronebreen, a fast-flowing, tidewater glacier in Svalbard
- Investigate controls on terminus conditions and calving processes at Tunabreen, a surge-type, tidewater glacier in Svalbard
- Develop a suite of photogrammetry tools for obtaining measurements from oblique time-lapse imagery
Techniques used: Monoscopic time-lapse photogrammetry, hot water borehole drilling, bathymetry surveying, satellite feature-tracking, passive seismic monitoring, melt/runoff modelling
Acquiring data from the field
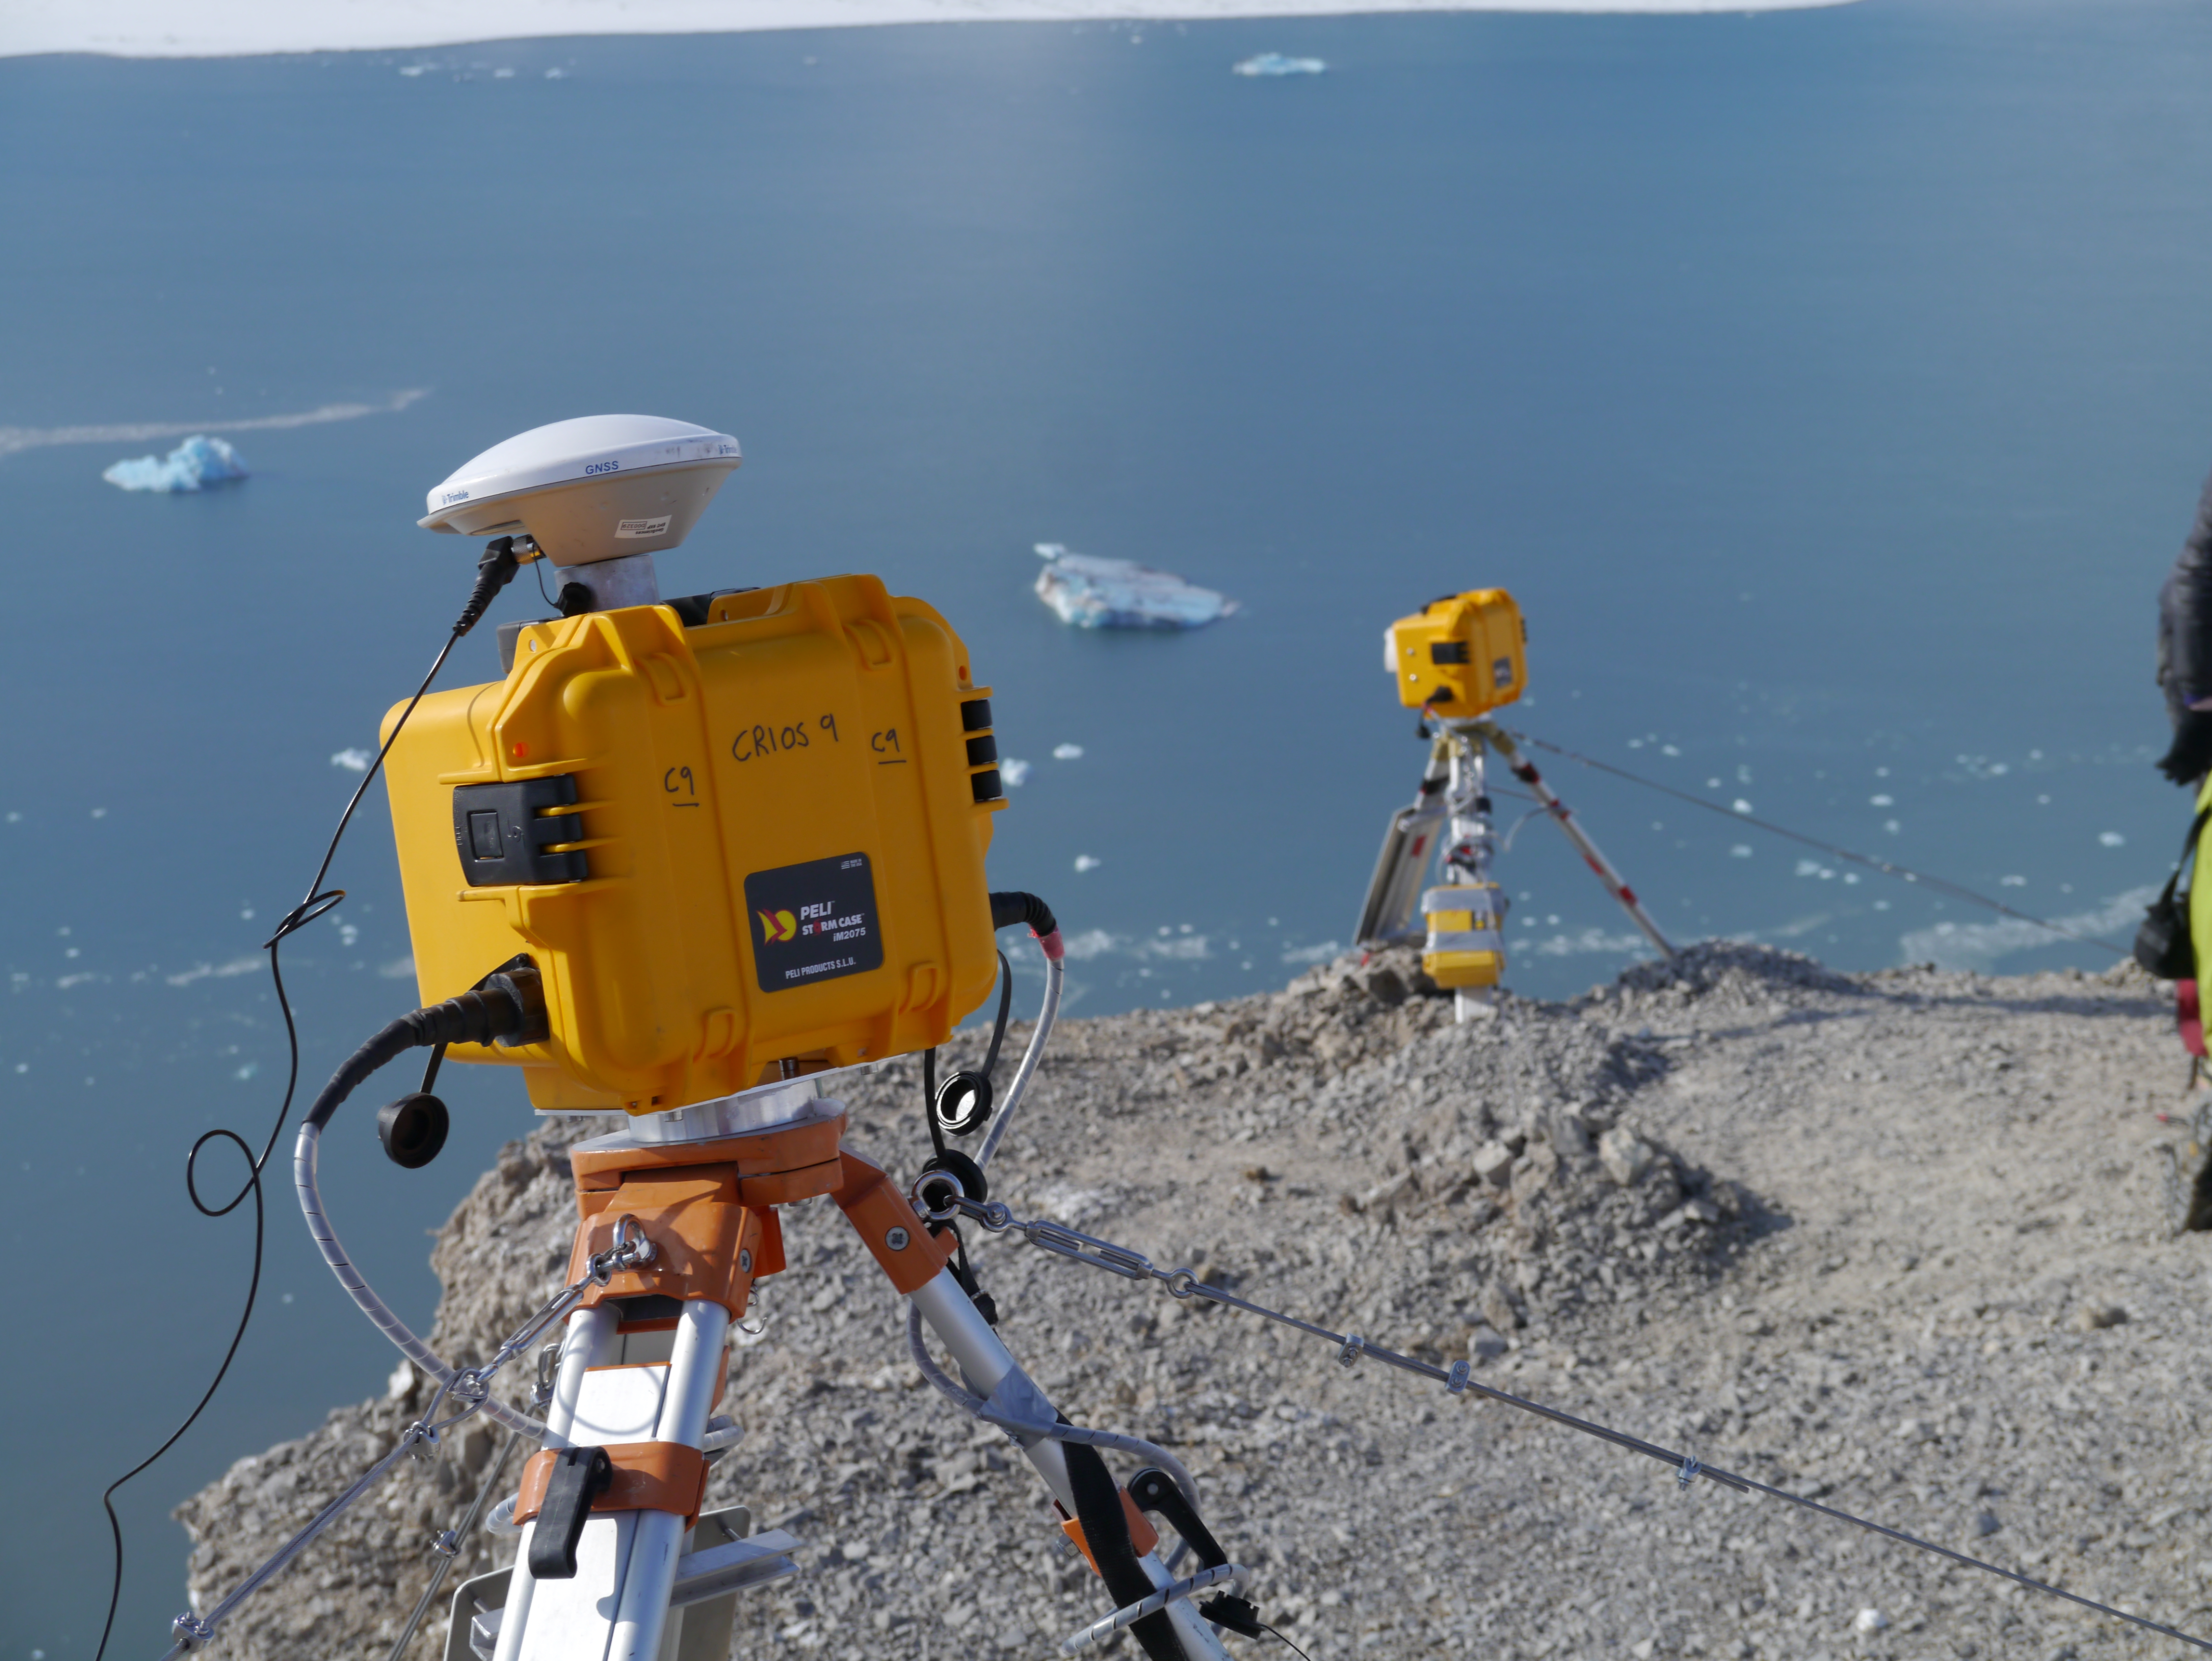
An example of one of our time-lapse cameras, installed at Kronebreen
High-detail monitoring of glacier termini is challenging. We decided to employ time-lapse photogrammetry as our primary technique in this study given that it can provide high-resolution data acquisition (e.g. 1 image every 3 seconds, over 24 hours) as well as appropriate acquisition rates for longer-term monitoring where needed (e.g. 1 image every hour over the course of a melt season). Therefore we can acquire different temporal frequencies depending on which aspects of the glacier system we want to examine.
Between 2014 and 2017, we deployed 7 - 14 time-lapse cameras at two glaciers in Svalbard (Kronebreen and Tunabreen) to monitor various aspects of the glacial system - ice flow, terminus retreat, supraglacial lake drainage, meltwater plumes, and local fjord circulation. We combined the findings from these images with other datasets (e.g. borehole measurements, bathymetry surveys) in order to examine dynamical change at a high level of detail.
Finding #1: Spatial variation in Kronebreen's ice flow is primarily controlled by meltwater routing at the glacier bed
From our time-lapse images over the 2014 melt season, along with borehole data analysis, melt/runoff modelling and hydropotential modelling, we found that spatial variations in ice flow at Kronebreen were primarily controlled by the location of subglacial meltwater channels.
Efficiency in subglacial water evacuation varied between the north and south regions of the glacier tongue, with the north channel configuration draining a large proportion of the glacier catchment through persistent channels, as indicated by hydropotential modelling. Channel configurations beneath the south region of the terminus were vastly different, with rapid hydrological changes evident and cyclic 'pulsing' suggested from the observed meltwater plume activity.
These differences in subglacial hydrology are reflected in ice flow, with faster velocities experienced in the south region of the glacier, facilitated by enhanced basal lubrication and sliding. Two speed-up events were observed at the beginning of the 2014 melt season, the second being of significant importance given that it occurred at the end of the melt season and enabled fast flow through the winter season. It is suggested that this event was caused by an abnormal high rainfall event which overwhelmed an inefficient hydrological regime entering its winter phase. This phenomena highlights that the timing of rainfall events at tidewater glaciers is fundamental to their impact on ice flow.

Sequential velocity maps (left) and velocity change maps (right) of Kronebreen showing the first of two speed-up events experienced during the 2014 melt season.
Finding #2: Terminus stability is inherently linked to both atmospheric and oceanic variability at Tunabreen. In particular, calving activity is primarily facilitated by melt-undercutting
Terminus conditions at Tunabreen were examined on two differing temporal scales:
- Over a one month period in peak melt season using time-lapse images acquired every 10 minutes
- Over a 28-hour period in August 2015 using time-lapse images acquired every 3 seconds
Over the one-month observation period, the terminus retreated 73.3 metres, with an average retreat rate of 1.83 metres per day. The frontal ablation rate fluctuated between 0 and 8.85 metres per day, and 1820 calving events were recorded of which 115 events were simultaneously detected from passive seismic signatures recorded in Longyearbyen. Overall, strong links were found between terminus position changes and both sea surface temperature and air temperature, suggesting that atmospheric forcing plays a larger role in terminus stability than previously considered.
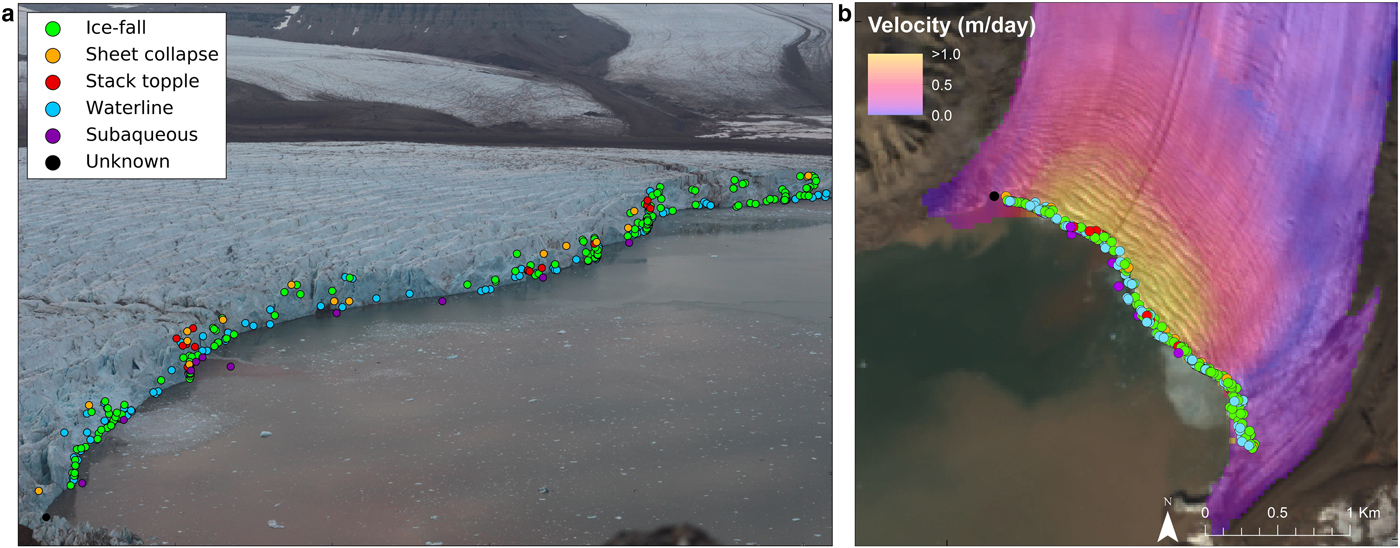
Calving events at Tunabreen over a 28-hour period in August 2015, captured using high-resolution time-lapse photography (one photo every three seconds). Calving events are categorised as subaerial (i.e. ice falling from the front above the waterline), subaqueous (i.e. ice breaking off from the front beneath the waterline), both (i.e. large calving events which contain both subaerial and subaqueous originating ice) and unknown (caused by concealment or poor visibility)
Calving activity at Tunabreen consists of frequent events, with 358 calving events detected from the 28-hour, high-frequency time-lapse sequence (i.e. 12.8 events per hour). The majority of these calving events (97%) occurred above the waterline despite the fact that 60-70% of the terminus is subaqueous (i.e. below the waterline). This suggests that ice loss below the waterline is dominated by submarine melting, rather than the break off of large projecting 'ice feet'. In addition, calving events are twice as frequent in the vicinity of the meltwater plumes, with visible undercutting (approximately 5 metres) revealed from the bathymetry side profiles. Overall, this suggests that enhanced submarine melting causes localised terminus instability at Tunabreen.
Finding #3: PyTrx is a viable Python-alternative toolbox for extracting measurements from oblique imagery of glacier environments
![]()
An example of PyTrx’s capabilities in deriving surface velocites at Kronebreen, Svalbard. Velocities are calculated from the image using a sparse feature-tracking approach, with unique corner features identified using Shi-Tomasi corner detection and subsequently tracked using Optical Flow approximation. In this example, 50 000 points have been successfully tracked between an image pair from Kronebreen, producing a dense collection of velocity points.
Time-lapse photogrammetry is a growing method in glaciology for providing measurements from oblique sequential imagery, namely glacier velocity. When we began processing our time-lapse images, we found that there were few publicly available toolboxes for what we wanted and the range of their applications was relatively small. For this reason we decided to develop PyTrx, a Python-alternative toolbox, to process our own data and also aid the progression of glacial photogrammetry with a wider range of toolboxes.
PyTrx is an object-oriented toolbox, consisting of six scripts that can be used to obtain velocity, area and line measurements from a series of oblique images. These six scripts are:
- CamEnv: Handles the associated data with the camera environment, namely the Ground Control Points (GCPs), information about the camera distortion, and the camera location and pose
- DEM: Handles data related to the scene, or Digital Elevation Model (DEM)
- FileHandler: Contains functions for reading in data from files (such as image data and calibration information) and exporting output data
- Images: Handles the image sequence and the data associate with each individual image
- Measure: Handles the functionality for calculating homography, velocities, surface areas and distances from oblique imagery
- Utilities: Contains the functions for plotting and interpolating data
PyTrx has been used to process the data presented previously, and is freely available on GitHub with several example applications also. These examples include deriving surface velocities and meltwater plume footprints from time-lapse images of Kronebreen, and terminus profiles and calving event locations from time-lapse images of Tunabreen.
Related links
This thesis is freely available to download from the Edinburgh Research Archive
How et al. (2017) The Cryosphere - Examining the subglacial hydrology of Kronebreen and its influence on glacier dynamics
How et al. (2019) Annals of Glaciology - Observations of calving styles at Tunabreen and the role of submarine melting in calving dynamics
How et al. (2020) Frontiers in Earth Science- Presenting the PyTrx toolbox and its capabilities with oblique imagery of glacial environments
PyTrx - PyTrx toolbox code repository, hosted on GitHub